EBITwhat?
One of the most perplexing things in accounting is why profit is not the same thing as cash. Well, those clever folks in finance have come up with a solution where profit does equal cash, but they’ve given it a name so obscure it guarantees no one will ever understand it: EBITDA.
Earnings Before Interest, Tax, Depreciation and Amortisation (EBITDA). It’s like a list of technical financial terms put in descending order of confusion. But it’s also the closest you’ll get in the profit and loss account to a measure of profit that matches the cash generative potential of the business.
There’s only two problems. The first is you won’t find it in the profit and loss account, you have to calculate it yourself. The second is that it is only a measure of cash coming in, and therefore you can’t rely on it as a measure of the actual cash left over.
Companies sometimes get round the first problem by volunteering the information so you don’t have to calculate it yourself but there’s no getting round the second problem, I’m afraid. Businesses still have to pay taxes, borrow and pay back loans, and make investments. These cash flows are ‘lumpy’. They do not fit the regular annual pattern of trade that the profit and loss account is good at measuring. Many of these activities, with the possible exception of paying tax, are discretionary. EBITDA is a good measure of underlying cash flow before these discretionary activities and therefore very helpful as a tool for valuing businesses. Indeed it was popularised by the private equity industry because it has a number of advantages when making the sort of highly leveraged business valuations that are their bread and butter.
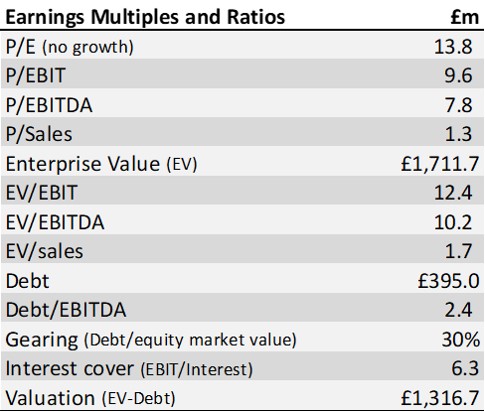
EBITDA gives a measure of the cash available for both shareholders and bondholders, the whole enterprise in other words. An accompanying concept is to calculate a company’s Enterprise Value (EV) which is, basically, the market value of its equity plus debt (net of cash). Both measures together give EV/EBITA, a multiple of earnings that is neutral to the capital structure of the business and therefore attractive to private equity as the starting point for its negotiations. It also allows the ratio of Debt/EBITDA to be calculated which is a measure of how highly leveraged a business is (x5 is high, x2.5 is medium, <1 is low).
EBITDA-related measures are the metric of choice for the private equity industry but traditional P/E ratios remain the preferred metric for public equity firms that are the bedrock of the savings and investment industry. Under conditions of zero debt they give exactly the same valuations, so both can co-exist, which is what happens now.
Some prefer a cousin of EBITDA called EBIT because it takes depreciation as a proxy for capital expenditure. In fact all earnings multiples are poor at taking account of capital expenditure so I don’t get too excited about the merits of this case.
For analysts comparing companies there’s no doubt EV/EBITDA is a superior metric. The following simple example illustrates why.
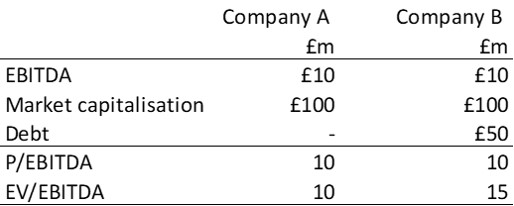
At first glance, it is not obvious that company B is the more highly valued company in this example. Turnover in both cases is the same, and they are equally profitable. In fact, although their equity is valued equally, company B is the more highly rated company. Its enterprise value is £150m (perhaps it has superior growth prospects) but, because of its debt, its equity value is £100m. If company B paid down all its debt, then its equity would be worth £150m. Enterprise valuation metrics are useful because they focus on the underlying economics of the business irrespective of its capital structure.
The important point is that earnings multiples are just benchmarks. It is therefore important to have a sense of what you are benchmarking against. To assist in that process, the table below summarises company profitability based on the average for the UK stock market as a whole to give you a sense of what UK plc is achieving.
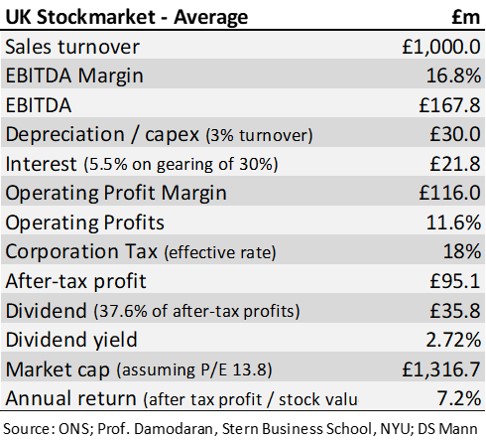
From this data can be calculated illustrative benchmarks based on stock market averages: