Predicting the stock market
No one can tell you where the stock market will be in one, two or three years, but almost anyone should be able to tell you where it will be in 10, 15 or 20 years. Forecasting the return from investing in the stock market is pretty straightforward if you apply just a few insights.
Inflation
Inflation is higher prices charged by companies. Its transmission to us, the consumer, is via the sales and costs of the aggregate of all businesses in the UK. In other words, when you invest in companies there is an inflation-tracking mechanism built in to your investment. It’s not as perfect as an index-linked investment product, but it’s a close approximation.
Nominal GDP
Nominal GDP is the actual monetary value of our national output before adjusting for inflation. It is – economists will have to forgive me – very roughly the equivalent to the aggregate of all the sales and costs of all businesses in the UK. It therefore incorporates inflation. It also incorporates the small but steady improvement in the efficiency with which we use resources – productivity. Productivity is the source of our national wealth. A stock market index is like a single share in UK plc. Over time, the value of the index should track nominal GDP. If you could anchor the stock market index at a particular point in time, when you were confident the index was ‘fairly’ valued and not suffering from a speculative boom or bust, then you could in principle use estimates of long run growth in nominal GDP to forecast the ‘true’ value of the index many years into the future.
Post-Bust Reality Checks
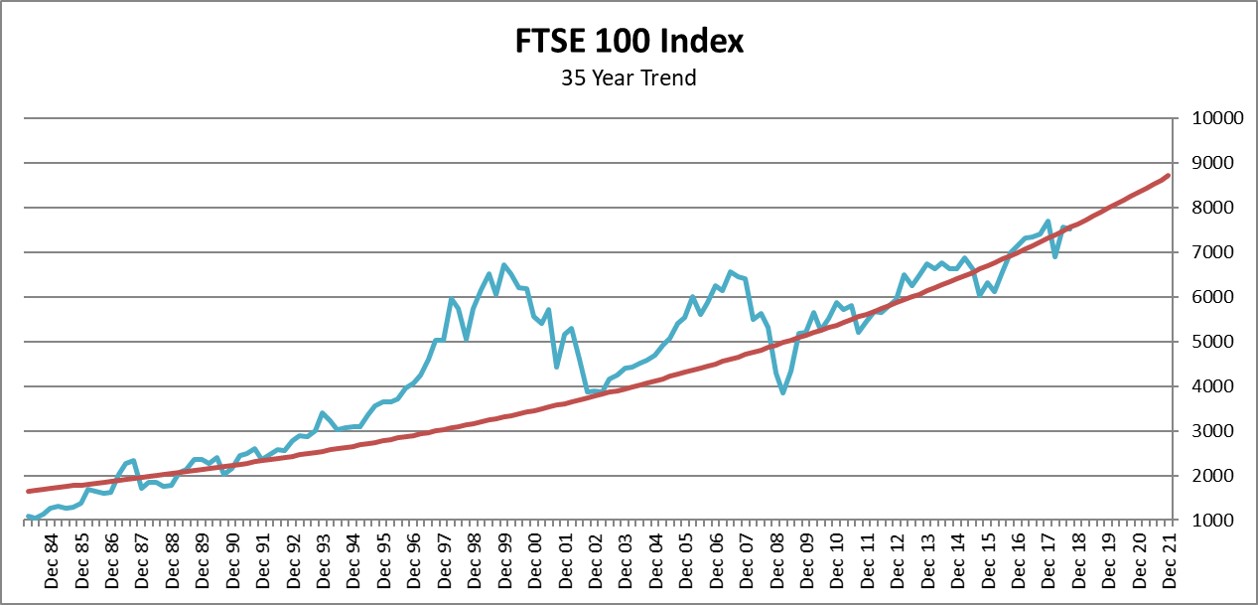
Because stock market valuations swing so violently, it is tricky to know at what point the index can ever be described as representing a true and fair valuation. However, a good approximation is the aftermath of one of the periodic ‘busts’ the market has suffered. Not the immediate aftermath, but a year on from the bust, when the dust clears, so to speak. If you noted the values of the index at these moments and then adjusted for nominal GDP up to a common point in time, then the average value of the separate estimates is a reasonable approximation to a ‘fair’ value of the index at that time. With that fixed point in time, you could use nominal GDP rates to draw a trend line backwards and forwards in time.
Here’s one I prepared earlier.
Lessons
This chart breaks my heart because I didn’t prepare it until 2012. Consequently I missed some excellent investment opportunities, firstly, in 2009 and then again in 2011. At these times I had money that I could have invested but decided against it. Had I known then what I know now, I would have had more confidence to take the plunge.
What this chart illustrates beautifully is why you can’t make credible forecasts for the stock market at a time-horizon of less than 5 years, and you are still taking a punt at less than 10 years.
An intriguing question is why the index hasn’t dropped below the red line more often. As it is based on average nominal GDP, you’d expect to be below trend routinely. Part of the answer might be optimism bias within the market.
Total Return
The assumption behind the chart above is that capital growth will follow long-term average growth in nominal GDP of 4.5% per annum. This is mostly made up of 3% inflation and 1.15% productivity. Capital growth is of course just one component of the return on investing in stocks and shares. The other is dividends. The table below assumes a dividend yield of 2.7% making the total expected return from investing in the stock market 7.2% per annum. Adjusted for inflation, the ‘real’ return is 4.2%.
Validating Assumptions
This analysis is not rocket science. If you read the financial press, you quickly realise that every financial advisor has their own ‘house’ assumptions that are the equivalent of the ones I’ve outlined. You can google historic returns that will throw up academic papers with which to benchmark these assumptions. Similar assumptions turn up in HM Treasury budget reports and can be inferred from long-range option pricing. That’s why I say almost anyone should be able to forecast stock market returns if the time horizon is long enough.
Being an accountant, I wasn’t happy leaving things there. In theory, the return from investing in the stock-market must in the long run come from corporate profits. The table below anchors a 7.2% stock market return to average corporate profitability.
The P/E ratio that equates to a 7.2% return in this example is 13.8 which, as the chart below shows, is reasonable for the results of single year, ignoring future growth.
And finally, I cross-checked what this notional average company would pay in dividend. Companies on average distribute 38% of after-tax profits and applying this average to the example above results in a dividend yield of 2.7% which, it turns out, is historically accurate for the UK. The table below validates the future nominal return from such a dividend by taking into account inflation, productivity and accumulating cash.
Volatility
The final insight into planning your investment strategy is that in every single year you can expect the highest and lowest values over 12 months to be about 20% apart. For this reason, your exit strategy has to be on a similarly long time-horizon as your investment strategy. You should certainly not be in the market if you have 5 years to go before retirement and you should start planning your exit when you are 10 years out.
Conclusion
The phrase ‘planning your retirement’ is the very definition of middle age and not something that gets the blood racing. I prefer to say, ‘By all means sale around the world, just make sure you can afford to come back’. The aim of this tutorial is to help you plan to do just that by removing the impression that investing in the stock market is ‘betting’ and that you need a crystal ball to know what it will do in the future. Instead I want to paint a picture of investment planning as being the accumulation of small gains leading to big gains over time.
The tutorial argues strongly for investing in the stock market, but won’t tell you in which shares to invest. It is silent on alternative classes of investment such as bonds or property. It especially won’t help you in the one thing that is more important than any of these – how much you save in the first place.